Running a big LLM across multiple GPUs with vLLM
A plain-English guide to serving a model too big for one GPU, in two tracks: a runbook from download to serving with every flag and error explained, and a deep dive into how tensor, pipeline, and expert parallelism split the model, with measured numbers from a 235B model on four RTX PRO 6000 cards.

New to the jargon? Every term, flag, and benchmark number here is explained in plain English in the local LLM glossary.
On this page (37)
- How to read this post
- The machine and the model
- The runbook: from download to serving
- Step 1: Getting the model onto the machine
- What you actually get
- Is there a standard shard size?
- Where it gets stored
- The disk trap, which is a real production hazard
- Step 2: Will it fit? The ten-minute check
- Step 3: Pick your split, then check it divides
- Step 4: Every flag, explained
- Step 5: The command, line by line
- Step 6: How to read the startup log
- Step 7: Benchmark it, and what we would run
- Step 8: Errors you will actually hit
- "must be divisible by tensor parallel size"
- "Failed to load model - not enough GPU memory"
- "Unknown SF transformation", the one that cost us the most time
- A confusing parse error when you try to run something else in the container
- "No available shared memory broadcast block found in 60 seconds"
- The deep dive: what splitting actually means
- Deep dive 1: Where the memory really goes
- Deep dive 2: Inference is two jobs
- Phase one: prefill, reading your prompt
- Phase two: decode, writing the answer
- How the server juggles many users
- Deep dive 3: The three ways to split
- Deep dive 4: Tensor parallelism, up close
- The KV cache gets divided too, which is a bonus
- Deep dive 5: The expert part
- Deep dive 6: Why you cannot split forever
- Deep dive 7: The proof
- The memory side
- The speed side
- The number we threw away, and why
- Wrapping up
- Credits and references
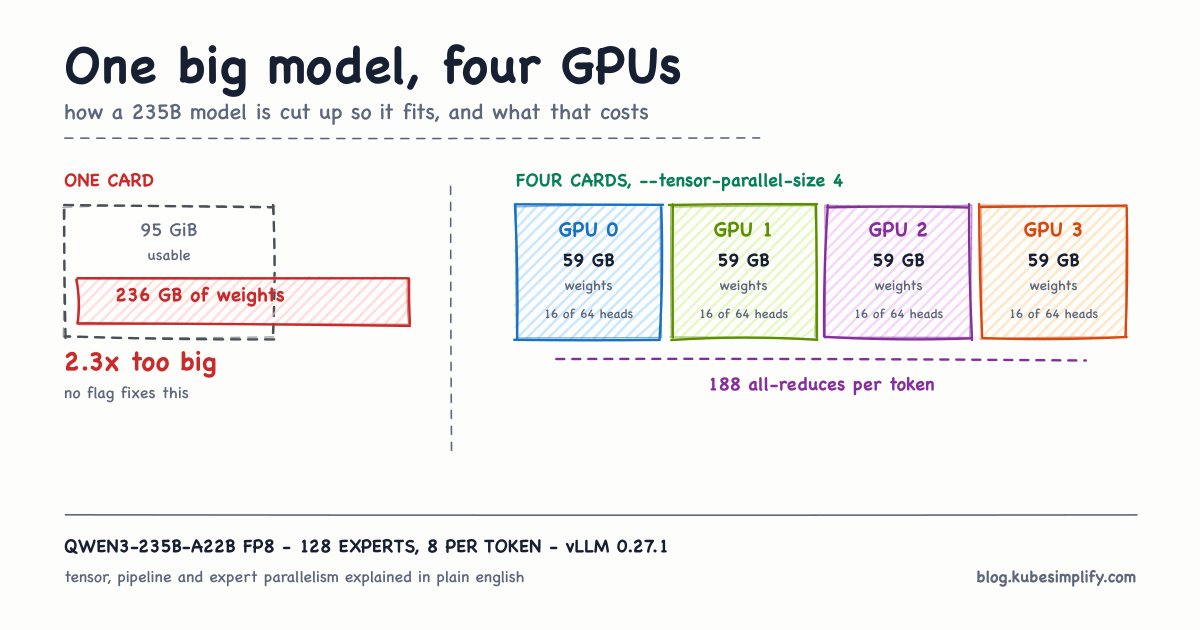
Sooner or later everyone running models locally hits the same wall. You find a model you want, you look at the download size, and it is bigger than the GPU you own. A 235B model needs roughly 236 GB just for its weights. The card we have holds 96 GB, and even the largest data-centre GPUs available today top out well below 236 GB. So the model does not fit, and no amount of clever flags will make 236 GB squeeze into 96 GB.
The answer is to use more than one GPU. That part everybody knows. The part that is genuinely confusing is what "use more than one GPU" actually means. Does each GPU get a copy of the model? Does the model get cut in half? Do the GPUs take turns? Which of those is happening, and what does it cost you?
Let's answer that properly, with a real model on real hardware. And let's be honest that not everyone is here for the same reason.
How to read this post #
First, why this post is shaped the way it is. Getting a big model serving and understanding how the serving works are two different jobs, usually done by two different people, or by the same person on two different days. An earlier version of this post ran both together, and that made it dense in exactly the wrong way: the reader with a deadline had to wade through all-reduce mechanics to reach the next command, and the reader who came for the mechanics kept tripping over Docker flags. We considered splitting it into two separate posts, but the deep dive's benchmark numbers come from the runbook's commands, and evidence belongs next to the thing it proves.
So: one post, two tracks, each with a clear exit. Pick your entrance based on the job in front of you:
| You are | You want | Read |
|---|---|---|
| Platform engineer, SRE, MLOps: you have the GPUs and a deadline | The model serving today | The runbook, Steps 1-8 (~20 min). Every command, flag, log line and error. Each step links into the deep dive at exactly the point a "why" earns its keep; follow those links only when something surprises you. |
| ML engineer, or just curious: no root access required | The mental model | The deep dive, sections 1-7 (~18 min). How the splitting actually works, and measured proof of when each method wins. Jump straight there. |
| Both | Everything | Read straight through. The runbook comes first because you cannot benchmark a server that is not running. |
New to the jargon? Every term, flag, and benchmark number here is explained in plain English in the local LLM glossary.
The machine and the model #
Both tracks lean on this section, so here it is once. Numbers mean nothing without the hardware attached.
The machine: a server with 8x NVIDIA RTX PRO 6000 Blackwell Server Edition cards. Each card has 96 GB of memory, and the machine reports 95.01 GiB of that as usable. We borrowed 4 of the 8 cards for this work.
One detail that matters more than it looks: these GPUs are not connected by NVLink. NVLink is NVIDIA's fast direct GPU-to-GPU cable. Without it, GPUs talk to each other over PCIe and through the CPU, which is slower. You can check what you have with one command:
root@utho-gpu-rtxpro6000-8-62383:~# nvidia-smi topo -m

| Device | GPU0 | GPU1 | GPU2 | GPU3 | GPU4 | GPU5 | GPU6 | GPU7 | NIC0 | CPU Affinity | NUMA Affinity | GPU NUMA ID |
| :--- | :---: | :---: | :---: | :---: | :---: | :---: | :---: | :---: | :---: | :--- | :---: | :---: |
| **GPU0** | **X** | SYS | SYS | SYS | SYS | SYS | SYS | SYS | SYS | 48-55,176-183 | 6 | N/A |
| **GPU1** | SYS | **X** | SYS | SYS | SYS | SYS | SYS | SYS | PHB | 32-39,160-167 | 4 | N/A |
| **GPU2** | SYS | SYS | **X** | SYS | SYS | SYS | SYS | SYS | SYS | 0-7,128-135 | 0 | N/A |
| **GPU3** | SYS | SYS | SYS | **X** | SYS | SYS | SYS | SYS | SYS | 16-23,144-151 | 2 | N/A |
| **GPU4** | SYS | SYS | SYS | SYS | **X** | SYS | SYS | SYS | SYS | 112-119,240-247 | 14 | N/A |
| **GPU5** | SYS | SYS | SYS | SYS | SYS | **X** | SYS | SYS | SYS | 96-103,224-231 | 12 | N/A |
| **GPU6** | SYS | SYS | SYS | SYS | SYS | SYS | **X** | SYS | SYS | 64-71,192-199 | 8 | N/A |
| **GPU7** | SYS | SYS | SYS | SYS | SYS | SYS | SYS | **X** | SYS | 80-87,208-215 | 10 | N/A |
| **NIC0** | SYS | PHB | SYS | SYS | SYS | SYS | SYS | SYS | **X** |  |  |  |

**Legend:**

| Symbol | Description |
| :--- | :--- |
| **X** | Self |
| **SYS** | Connection traversing PCIe as well as the SMP interconnect between NUMA nodes (e.g., QPI/UPI) |
| **NODE** | Connection traversing PCIe as well as the interconnect between PCIe Host Bridges within a NUMA node |
| **PHB** | Connection traversing PCIe as well as a PCIe Host Bridge (typically the CPU) |
| **PXB** | Connection traversing multiple PCIe bridges (without traversing the PCIe Host Bridge) |
| **PIX** | Connection traversing at most a single PCIe bridge |
| **NV#** | Connection traversing a bonded set of `#` NVLinks |
| **NIC0** | `mlx4_0` |On our machine every pair of GPUs reports SYS, which means the traffic goes across PCIe and then across the link between the CPU sockets. If you had NVLink you would see NV1, NV2 and so on instead. Keep this in mind, because it changes which splitting method is fastest.
The model: Qwen/Qwen3-235B-A22B-Instruct-2507-FP8. Let's unpack that name, because it is doing a lot of work:
- 235B is the total parameter count, 235 billion.
- A22B means 22 billion active parameters. This is a mixture-of-experts model: each layer holds 128 small expert networks and a router picks just 8 of them per token, so you pay for 235B in memory but only about 22B in arithmetic. Deep dive 5 tells the full story.
- FP8 is the number format the weights are stored in, 8 bits each, so one byte per parameter.
The software: vLLM 0.27.1 running in the official container, with PyTorch 2.13.0 and CUDA 13.0, on driver 610.43.02.
The runbook: from download to serving #
Written for the person with root on the box. Eight steps, and at the end of them a 235B model is answering requests on four GPUs. No prior knowledge of distributed computing is assumed: if you know what a GPU is and you have run a model locally once, you are qualified.
Step 1: Getting the model onto the machine #
Before anything can be split across GPUs it has to be on the disk, and with a model this size that step is not a formality. It is the step that bit us hardest, so let's do it properly.
You download it with the Hugging Face CLI:
root@utho-gpu-rtxpro6000-8-62383:~# pip install huggingface_hub hf_transfer
root@utho-gpu-rtxpro6000-8-62383:~# HF_XET_HIGH_PERFORMANCE=1 hf download Qwen/Qwen3-235B-A22B-Instruct-2507-FP8
Downloading bytes: ████████████████████████████████████████████████▏                                                                                                             | 24.4GB,  234MB/s
Reconstructing (incomplete total...):  13%|███████████████▋                                                                                                             | 10.0GB / 80.0GB,  104MB/s
Fetching 34 files:   0%|                                                                                                                                                      | 0/34 [00:00<?, ?it/s]
HF_XET_HIGH_PERFORMANCE=1 switches on a downloader that parallelises across connections. On a 236 GB download that is the difference between an hour and most of an afternoon, so it is worth the extra package.
What you actually get #
The download is not one giant file. It arrives as 24 shards, plus the small text files that describe the model:
config.json
generation_config.json
model-00001-of-00024.safetensors
model-00002-of-00024.safetensors
...
model-00024-of-00024.safetensors
model.safetensors.index.json
tokenizer.jsonA few things worth understanding here:
.safetensorsfiles hold the actual weights. Each one starts with a small table of contents saying what is inside and exactly where each piece begins and ends. So a program can jump straight to the piece it needs instead of reading the whole file. This is called memory-mapping, and it matters later. And unlike the old.binformat, simply opening one of these files can never run hidden code on your machine.model.safetensors.index.jsonis the master map. The weights are spread over 24 files, and this map says which file each piece lives in. When vLLM needs layer 62, it looks here, sees shard 17, and opens only that file.config.jsonis the model's spec sheet: how many layers, how many heads, how many experts. It is a few kilobytes, and it decides almost everything in this post, including how many GPUs you can split across.- Because this model is FP8, each weight is stored in a single byte, and a single byte cannot record very large and very small numbers accurately at the same time. The checkpoint fixes this the way a paper map does. A map shrinks a whole city onto one page, and its legend tells you how to undo the shrinking: 1 cm on the page equals 1 km in the world. Same idea here: the weights are cut into blocks of 128 by 128 numbers, every block is shrunk until its values fit in one byte each, and each block carries one extra number, its scale, which is the legend for that block. To get a real weight back, the GPU multiplies the stored byte by its block's scale. These block scales ship in the download right alongside the weights, and you can see the whole arrangement declared in
config.json:
"quantization_config": {
  "quant_method": "fp8",
  "fmt": "e4m3",
  "weight_block_size": [128, 128],
  "activation_scheme": "dynamic"
}Remember those block scales. They are the reason for the most annoying crash we hit, down in Step 8.
Is there a standard shard size? #
Not a formal one, but there are firm conventions. The Hub's guidance is to split large files into chunks under 200 GB, with 500 GB as the hard limit for a single file, for two practical reasons: a failed download of a smaller file resumes cheaply, and the CDN does not cache huge files, so one 236 GB file would genuinely download slower than 24 pieces of it. What publishers actually pick sits far below those limits. Our model uses a 10 GB cap: 23 shards of exactly 10.00 GB and a 24th holding the remaining 6.45 GB, for 236.45 GB in total.
One thing the shard files do not line up with is the model's structure. The saver walks through the weights and fills each file to the 10 GB cap, then starts the next one, paying no attention to where a layer begins or ends. So no file contains "layers 1 to 4"; a file contains whatever bytes landed in it, and a single layer's pieces can straddle two files.
If you want a feel for the volume anyway: one layer of this model weighs about 236 GB / 94 = 2.5 GB in FP8, so each 10 GB file holds about four layers' worth of material, the way a moving box holds "one shelf's worth of books" without holding any particular shelf. That is exactly why the master map from earlier exists: without it, nobody would know where anything landed.
Does any of this affect serving? No. Whether the weights are packaged as a single file or as 24 changes nothing about the numbers inside, and because safetensors files are memory-mapped, the program loading them (vLLM, in our case) jumps straight to the pieces it needs no matter how they are grouped into files. Shard size is a distribution question, not an inference question.
Where it gets stored #
By default everything lands under ~/.cache/huggingface/hub, in a layout that looks strange the first time you see it:
~/.cache/huggingface/hub/models--Qwen--Qwen3-235B-A22B-Instruct-2507-FP8/
├── blobs/          <- the real files, named by hash
├── refs/           <- which commit "main" points at
└── snapshots/
└── e156cb4e.../ <- symlinks with friendly names, pointing into blobs/The content lives once in blobs/ under its hash, and snapshots/ holds human-readable symlinks into it. That is why pulling two revisions of a model does not always double your disk usage, and it is also why du and df can disagree with your intuition.
The practical consequence for serving: mount that whole directory into your container and set HF_HOME to it, which is exactly what the -v and -e HF_HOME flags in Step 5 are doing. Otherwise the container downloads its own copy.
One more thing about loading that surprises people. When you split the model over 4 GPUs, vLLM starts 4 separate processes, one per GPU, and every one of them reads the whole download from disk, keeping only the quarter it needs.
vLLM's own docs say it plainly: with tensor parallelism, "each process will read the whole model and split it into chunks". So at -tp 4 the machine reads the 236 GB not once but four times, close to a full terabyte of disk reads before the server can answer anything. That is why a big model takes minutes to load even from a fast disk.
Our first Model loading took line said 45 seconds, but only because we had just downloaded the model, so most of it was still sitting in RAM, where the operating system keeps recently used files. From a cold disk it takes much longer.
The disk trap, which is a real production hazard #
On a shared machine, filling the disk can take down everything else on it. This is the part we learned the hard way, and it is worth more than a footnote. Our test box also runs a Kubernetes inference platform. Kubernetes treats free disk as a managed resource called ephemeral-storage, and when free space fell below its eviction threshold, the kubelet did exactly what it is designed to do: it evicted pods to reclaim space, tainted the node so nothing new could schedule, and garbage-collected container images. Several of those images had been built locally and existed in no registry, so they could not simply be pulled again.
Nothing about that is a Kubernetes bug, and nothing about it is specific to our setup. The lesson generalises: before you download a quarter of a terabyte onto a machine, check what else lives on that disk and what will happen when it fills. df -h before you start, and know your platform's eviction threshold, which is often far higher than "0 bytes free". If the machine is shared, keeping a couple of hundred gigabytes of headroom is not paranoia.
Step 2: Will it fit? The ten-minute check #
Do this on paper before the download, not after. The arithmetic is simpler than people expect.
First, the weights. One parameter costs this many bytes:
| Format | Bits per parameter | Bytes per parameter |
|---|---|---|
| FP32 | 32 | 4 |
| BF16 or FP16 | 16 | 2 |
| FP8 | 8 | 1 |
| FP4 or NVFP4 | 4 | 0.5 |
Weights = parameters x bytes per parameter. For our model: 235 billion at 1 byte each, about 236 GB. Our GPU holds 95.01 GiB, so the model is roughly 2.3 times too big for one card. That number alone tells you the minimum GPU count.
Second, remember weights are only one of three things that must fit:
- The weights. Fixed size, known before you start.
- The KV cache. The model's memory of the conversation so far. It grows with prompt length and with how many users you serve at once.
- Working space. Scratch memory for the calculations, plus framework overhead.
Third, size the cache. Every term comes straight out of the model's config.json:
bytes per token = 2 x layers x kv_heads x head_dim x bytes_per_numberFor our model: 2 x 94 x 4 x 128 x 2 = 192,512 bytes, call it 188 KiB per token. Sounds small, but this model supports a 262,144-token context, so one single full-length conversation would need about 47 GiB. That is half a GPU for one user, and it is why "the weights fit, so I am fine" is wrong. It is also why --max-model-len exists, as you will see in the flags table. Deep dive 1 unpacks where this formula comes from.
One piece of good news: under tensor parallelism the KV cache is divided across GPUs rather than duplicated, so 4 GPUs give you roughly 4x the conversation room on top of making the weights fit. Why that falls out of how the split works is in Deep dive 4.
Memory fit animation
The same model on 1, 2 and 4 GPUs
Every number here came out of a real run. All three bars are drawn to the same scale, and the dashed line is the 85.51 GiB that vLLM may use on one card at --gpu-memory-utilization 0.90. A bar reaching past that line means the model does not fit. Watch it shrink as GPUs are added, and note that it takes 4 before the bar finally lands to the left of the line.
Step 3: Pick your split, then check it divides #
vLLM gives you three ways to spread a model over GPUs, and they are genuinely different things. The one-minute version, so you can pick a flag and move on (the full mechanics, with animations, start at Deep dive 3):
- Tensor parallelism (
--tensor-parallel-size) slices every layer across all GPUs, so they all work on the same token at once. Best tokens per second, evenly split memory, divided KV cache. The default choice for GPUs inside one machine. This is what we run. - Pipeline parallelism (
--pipeline-parallel-size) gives each GPU a block of consecutive layers and passes the work along. The GPUs barely need to talk to each other, so it is the tool for spanning machines with a slow network, and it wins on time to first token, but GPUs spend time waiting their turn. - Expert parallelism (
--enable-expert-parallel) exists only for mixture-of-experts models and hands out whole experts instead of slicing them. Its job is trillion-parameter-scale clusters where even a tensor-parallel split cannot hold all the experts. It is not a memory saver at our scale, as the measurements prove.
Then the ten-second pre-flight check. You cannot pick any number for --tensor-parallel-size: because attention heads are handed out whole, your TP size must divide the model's head counts. Open config.json:
{
  "num_hidden_layers": 94,
  "hidden_size": 4096,
  "num_attention_heads": 64,
  "num_key_value_heads": 4,
  "head_dim": 128,
  "num_experts": 128,
  "num_experts_per_tok": 8
}For our model:
num_attention_headsis 64, so 2, 4, 8, 16 all divide it cleanly.num_key_value_headsis 4. This is the binding constraint. At-tp 4each GPU gets exactly one key/value head. At-tp 8there are not enough to go around, and vLLM has to duplicate them across GPUs, which wastes memory and gives you less benefit than you would hope.num_expertsis 128, which divides evenly by 4 and by 8, so expert parallelism has more freedom than tensor parallelism here.
That is the real lesson: the KV head count, not the parameter count, usually decides how wide you can go. It is the first thing we check on any new model, and it takes ten seconds. Deep dive 6 explains why the KV heads bind first.
Step 4: Every flag, explained #
Before the command, the vocabulary. Here is every flag we use and why it has the value it has. If you only remember one thing from the runbook, make it this table.
| Flag | What it does | Why our value |
|---|---|---|
--tensor-parallel-size 4 | How many GPUs to slice each layer across. Often shortened to -tp. | 236 GB of weights needs at least 3 cards of 95 GiB, and 4 divides the model's head counts cleanly. |
--pipeline-parallel-size 1 | How many groups to cut the layer stack into. Often -pp. | 1 means off. We test a version with 4 later. |
--enable-expert-parallel | Hand out whole experts per GPU instead of slicing every expert. Mixture-of-experts models only. | Tested both ways, since this is exactly the choice a big MoE forces on you. |
--gpu-memory-utilization 0.90 | The fraction of each GPU's memory vLLM is allowed to claim, for weights plus KV cache plus working space. | 0.90 leaves a little headroom. Push it to 0.95 for more cache, but leave room or startup fails. |
--max-model-len 32768 | The longest single request, prompt plus reply, in tokens. | The model supports 262,144, but that would eat 47 GiB of cache for one user. 32,768 is a sane serving value. |
--max-num-seqs 32 | How many requests may be in flight at once. | Caps how much KV cache can be demanded simultaneously. Lower it if you see requests being preempted. |
--served-model-name qwen3-235b | The name clients use in the API. | Otherwise clients must send the full checkpoint path. |
--port 8000 | Port for the OpenAI-compatible API. | Convention. |
--distributed-executor-backend mp | How the GPU worker processes are managed: mp for plain Python multiprocessing, ray for a Ray cluster. | All 4 GPUs are in one machine, so mp is the simpler choice. ray is for multiple machines. |
--enforce-eager | Skips building optimised CUDA graphs at startup. | We do not use it. It saves memory and starts faster, but generation is slower. Reach for it only if you are out of memory. |
--kv-cache-dtype fp8 | Stores the conversation cache at 8 bits instead of 16, roughly halving cache memory. | We left it at the default so our cache numbers are easy to check by hand. It is a good lever if you need more concurrency. |
Two container flags matter just as much, and neither is a vLLM flag:
| Docker flag | Why you need it |
|---|---|
--ipc=host | The GPU workers are separate processes that pass data through shared memory. Docker's default 64 MB of shared memory is far too small, and leaving this out gives you a confusing hang at startup. |
--gpus '"device=1,4,5,6"' | Hands specific GPUs to the container. The nested quoting is fussy but required. Inside the container they are renumbered 0 to 3. |
Step 5: The command, line by line #
Here is the whole thing. Every line is explained above, and we will walk the structure below it.
root@utho-gpu-rtxpro6000-8-62383:~# docker run -d --name vllm-tp4 \
  --gpus '"device=1,4,5,6"' \
  --ipc=host \
  -p 8000:8000 \
  -v /root/.cache/huggingface:/root/.cache/huggingface \
  -e HF_HUB_OFFLINE=1 \
  -e HF_HOME=/root/.cache/huggingface \
  -e VLLM_USE_DEEP_GEMM=0 \
  vllm/vllm-openai:latest \
    Qwen/Qwen3-235B-A22B-Instruct-2507-FP8 \
    --served-model-name qwen3-235b \
    --tensor-parallel-size 4 \
    --gpu-memory-utilization 0.90 \
    --max-model-len 32768 \
    --max-num-seqs 32 \
    --port 8000
.
.
.
(Worker_TP0 pid=770) INFO 08-21 18:18:05 [gpu_model_runner.py:5405] Model loading took 55.19 GiB memory and 48.502592 seconds
(EngineCore pid=558) INFO 08-21 18:21:55 [kv_cache_utils.py:2235] GPU KV cache size: 621,392 tokens
(EngineCore pid=558) INFO 08-21 18:21:55 [kv_cache_utils.py:2236] Maximum concurrency for 32,768 tokens per request: 18.96x
(Worker_TP1 pid=771) INFO 08-21 18:22:06 [gpu_worker.py:789] Free memory on device (94.05/95.01 GiB) on startup. Desired GPU memory utilization is (0.9, 85.51 GiB). Actual usage is 56.89 GiB for consumed memory (weights + non-torch), 0.76 GiB for peak activation, and 0.32 GiB for CUDAGraph memory. Replace gpu_memory_utilization config with `--kv-cache-memory=29407858586` (27.39 GiB) to fit into requested memory, or `--kv-cache-memory=38581581312` (35.93 GiB) to fully utilize gpu memory. Current kv cache memory in use is 27.85 GiB.
(Worker_TP0 pid=770) INFO 08-21 18:22:06 [gpu_worker.py:789] Free memory on device (94.05/95.01 GiB) on startup. Desired GPU memory utilization is (0.9, 85.51 GiB). Actual usage is 56.89 GiB for consumed memory (weights + non-torch), 0.76 GiB for peak activation, and 0.32 GiB for CUDAGraph memory. Replace gpu_memory_utilization config with `--kv-cache-memory=29407858586` (27.39 GiB) to fit into requested memory, or `--kv-cache-memory=38581581312` (35.93 GiB) to fully utilize gpu memory. Current kv cache memory in use is 27.85 GiB.
(Worker_TP3 pid=773) INFO 08-21 18:22:06 [gpu_worker.py:789] Free memory on device (94.05/95.01 GiB) on startup. Desired GPU memory utilization is (0.9, 85.51 GiB). Actual usage is 56.89 GiB for consumed memory (weights + non-torch), 0.76 GiB for peak activation, and 0.32 GiB for CUDAGraph memory. Replace gpu_memory_utilization config with `--kv-cache-memory=29407858586` (27.39 GiB) to fit into requested memory, or `--kv-cache-memory=38581581312` (35.93 GiB) to fully utilize gpu memory. Current kv cache memory in use is 27.85 GiB.
(Worker_TP2 pid=772) INFO 08-21 18:22:06 [gpu_worker.py:789] Free memory on device (94.05/95.01 GiB) on startup. Desired GPU memory utilization is (0.9, 85.51 GiB). Actual usage is 56.89 GiB for consumed memory (weights + non-torch), 0.76 GiB for peak activation, and 0.32 GiB for CUDAGraph memory. Replace gpu_memory_utilization config with `--kv-cache-memory=29407858586` (27.39 GiB) to fit into requested memory, or `--kv-cache-memory=38581581312` (35.93 GiB) to fully utilize gpu memory. Current kv cache memory in use is 27.85 GiB.
Reading it top to bottom:
docker run -dstarts the container in the background and prints its id. Drop the-dif you would rather watch the logs scroll past.--name vllm-tp4gives it a name so you can saydocker logs vllm-tp4instead of copying an id.-p 8000:8000maps the container's port 8000 to the host's port 8000, so you can reach the API from outside.-v /root/.cache/huggingface:/root/.cache/huggingfaceshares your downloaded models with the container. Without it the container would download all 236 GB again.-e HF_HUB_OFFLINE=1tells the Hugging Face library not to phone home. It uses the local copy, which also means startup does not fail if the network is down.vllm/vllm-openai:latestis the image. Everything after it is passed to vLLM, because the image's entrypoint is alreadyvllm serve.- The first argument after the image is the model. Everything after that is a vLLM flag from the table above.
-e VLLM_USE_DEEP_GEMM=0is here because without it this exact model would not start on these exact GPUs. It is not a general recommendation, and Step 8 explains the crash it avoids. If you are on different hardware, try without it first.
One thing worth knowing about that entrypoint: because it is already vllm serve, running docker run ... vllm/vllm-openai:latest python3 -c "..." does not work the way you expect. Your Python gets handed to vllm serve as arguments and you get a confusing parse error. To run something else inside the image, override it:
root@utho-gpu-rtxpro6000-8-62383:~# docker run --rm --gpus '"device=1,4"' --entrypoint python3 vllm/vllm-openai:latest -c "
import torch
print('GPUs visible:', torch.cuda.device_count())
print('can GPU 0 talk to GPU 1 directly:', torch.cuda.can_device_access_peer(0, 1))
"
GPUs visible: 2
can GPU 0 talk to GPU 1 directly: TrueThat is a genuinely useful sanity check before you start a long model load, because it confirms the container can see the cards and that direct GPU-to-GPU access is available.
Step 6: How to read the startup log #
The startup log is the best teaching tool in the whole stack, and almost nobody reads it. Four lines tell you everything about whether your configuration is sensible.
Line one, how big the weights are per GPU. You get one of these per worker:
(Worker_TP0) Model loading took X GiBIf you divide the full model size by your --tensor-parallel-size and get roughly this number, the split worked. If this number equals the whole model, something is wrong and you are not actually splitting.
Line two, what is left for conversations:
Available KV cache memory: X GiBIf this is negative, your weights plus overhead already exceeded the budget, and vLLM will refuse to start. That is the clearest possible signal that you need more GPUs, a smaller number format, or a lower --max-model-len.
Line three, the cache in tokens:
GPU KV cache size: N tokensThis is the total number of tokens the server can remember across all users at once. You can predict it: take the available cache memory, divide by the bytes-per-token figure from Step 2 (divided by your TP size, since each card keeps only its own heads' share).
Line four, how many users that really means:
Maximum concurrency for 32,768 tokens per request: N.NNxThis is the one to show your capacity planner. If it says 2.05x, then two users can each have a full-length 32k conversation, and a third will have to wait or be preempted. It is simply the previous line divided by --max-model-len.
For our run the four lines came out as: Model loading took 55.19 GiB per worker, Available KV cache memory: 27.85 GiB, GPU KV cache size: 621,392 tokens, and a maximum concurrency of 18.96x at 32k. Predicting that token count by hand, 27.85 GiB divided by 47 KiB per token per card, gives 621,337 against the 621,392 vLLM printed, which is the kind of agreement that tells you the mental model is right.
Step 7: Benchmark it, and what we would run #
Once it was running, we compared all three ways of splitting the same model over the same 4 GPUs: tensor parallelism on its own, tensor parallelism plus expert parallelism, and pure pipeline parallelism. Same hardware, same flags otherwise, same benchmark.
Two sentences of background so the results make sense: inference is two different jobs. Prefill reads your whole prompt at once, is limited by compute, and decides time to first token, while decode writes the answer one token at a time, is limited by memory bandwidth, and decides tokens per second. Every configuration trades one against the other, and Deep dive 2 explains exactly why.
The benchmark is vLLM's own, 1024 tokens in and 256 tokens out per request, with --ignore-eos so every request generates exactly 256 tokens and the comparison is fair:
root@utho-gpu-rtxpro6000-8-62383:~# docker exec vllm-tp4 vllm bench serve \
  --model Qwen/Qwen3-235B-A22B-Instruct-2507-FP8 \
  --served-model-name qwen3-235b \
  --base-url http://localhost:8000 \
  --dataset-name random --random-input-len 1024 --random-output-len 256 \
  --max-concurrency 1 --num-prompts 12 --seed 42 --ignore-eos

Starting initial single prompt test run...
Skipping endpoint ready check.
Starting main benchmark run...
Traffic request rate: inf
Burstiness factor: 1.0 (Poisson process)
Maximum request concurrency: 1
100%|██████████| 12/12 [00:55<00:00,  4.62s/it]
tip: install termplotlib and gnuplot to plot the metrics
============ Serving Benchmark Result ============
Successful requests:                     12
Failed requests:                         0
Maximum request concurrency:             1
Benchmark duration (s):                  55.38
Total input tokens:                      12288
Total generated tokens:                  3072
Request throughput (req/s):              0.22
Output token throughput (tok/s):         55.47
Peak output token throughput (tok/s):    60.00
Peak concurrent requests:                2.00
Total token throughput (tok/s):          277.34
---------------Time to First Token----------------
Mean TTFT (ms):                          255.31
Median TTFT (ms):                        251.60
P99 TTFT (ms):                           272.03
-----Time per Output Token (excl. 1st token)------
Mean TPOT (ms):                          17.10
Median TPOT (ms):                        17.14
P99 TPOT (ms):                           17.16
---------------Inter-token Latency----------------
Mean ITL (ms):                           17.10
Median ITL (ms):                         17.13
P99 ITL (ms):                            17.79
==================================================and then again with 32 requests in flight, which is the same command with two numbers changed:
--max-concurrency 32 --num-prompts 640

Starting initial single prompt test run...
Skipping endpoint ready check.
Starting main benchmark run...
Traffic request rate: inf
Burstiness factor: 1.0 (Poisson process)
Maximum request concurrency: 32
100%|██████████| 640/640 [04:22<00:00,  2.44it/s]
tip: install termplotlib and gnuplot to plot the metrics
============ Serving Benchmark Result ============
Successful requests:                     640
Failed requests:                         0
Maximum request concurrency:             32
Benchmark duration (s):                  262.63
Total input tokens:                      655360
Total generated tokens:                  163840
Request throughput (req/s):              2.44
Output token throughput (tok/s):         623.85
Peak output token throughput (tok/s):    960.00
Peak concurrent requests:                64.00
Total token throughput (tok/s):          3119.25
---------------Time to First Token----------------
Mean TTFT (ms):                          2070.58
Median TTFT (ms):                        504.97
P99 TTFT (ms):                           6028.94
-----Time per Output Token (excl. 1st token)------
Mean TPOT (ms):                          43.36
Median TPOT (ms):                        40.53
P99 TPOT (ms):                           62.56
---------------Inter-token Latency----------------
Mean ITL (ms):                           43.36
Median ITL (ms):                         37.67
P99 ITL (ms):                            65.99
----------------End-to-end Latency----------------
Mean E2EL (ms):                          13126.87
Median E2EL (ms):                        13148.27
P99 E2EL (ms):                           17041.19
One benchmarking warning before you copy this: if you re-run against a warm server, either vary the --seed or turn prefix caching off, otherwise your second measurement is mostly measuring vLLM's prompt cache. The full story of the misleading numbers we caught is in Deep dive 7.
The verdict. The complete tables and number-by-number interpretation live in Deep dive 7; here is what they add up to:
- Tensor Parallelism (TP) won nearly everything:
- Throughput: 623.85 output tokens/sec at 32 concurrent requests (70% faster than pipeline parallelism).
- Decode Latency: Fastest single-request decode at 17.14 ms median per token.
- Capacity: Largest conversation capacity with 621,392 cached tokens (~19 concurrent 32k conversations).
- Memory: Perfectly even memory distribution across all four cards.
- Pipeline Parallelism (PP): Won exactly one metric which was time to first token (TTFT) by 15%.
- Expert Parallelism (EP): Cost 7% overhead and returned no benefit at this scale.
So for a 235B MoE on 4 GPUs with no NVLink between them, we would use plain --tensor-parallel-size 4 and leave both of the others off. It was faster nearly everywhere, it gives the most conversation capacity, it splits memory perfectly evenly, and it is one less thing to reason about.
We would reach for the other two in specific situations, not as general upgrades:
- Pipeline parallelism in two situations. First, when what your users notice most is how quickly the first word of an answer appears: in our runs it delivered the first token 15% sooner than tensor parallelism. Second, when your GPUs sit in different machines joined by an ordinary network: tensor parallelism makes the GPUs talk to each other constantly for every token, which a slow network turns into a bottleneck, while pipeline parallelism hands work to the next GPU just once per token, so a slow network barely hurts it.
- Expert parallelism when the model is so large that even a tensor-parallel split cannot hold all the experts, which is a real problem at trillion-parameter scale and simply is not our problem at 235B on 4 cards.
Step 8: Errors you will actually hit #
Every one of these is a real message we collected while doing this, not a hypothetical.
"must be divisible by tensor parallel size" #
We asked for 3 GPUs, which is a perfectly reasonable-sounding thing to want, and got:
pydantic_core._pydantic_core.ValidationError: 1 validation error for VllmConfig
  Value error, Total number of attention heads (64) must be divisible by tensor
parallel size (3).What it means: the rule from Step 3. 64 heads cannot be shared out evenly among 3 GPUs. Good news, it fails in about a second, before loading a single byte of weights.
The fix: pick a --tensor-parallel-size that divides your head count. Powers of two are the safe habit.
"Failed to load model - not enough GPU memory" #
Then we tried 2 GPUs, which puts about 110 GiB of weights on a 95 GiB card. It got most of the way through loading and then died:
ERROR [gpu_model_runner.py:5403] Failed to load model - not enough GPU memory.
Try lowering --gpu-memory-utilization to free memory for weights, increasing
--tensor-parallel-size, or using --quantization.
(original error: CUDA out of memory. Tried to allocate 768.00 MiB. GPU 0 has a
total capacity of 95.01 GiB of which 438.31 MiB is free. Including non-PyTorch
memory, this process has 94.57 GiB memory in use.)What it means: exactly what it says. The weights for half this model do not fit on one of these cards. Note the useful detail in there, 438.31 MiB is free out of 95.01 GiB, so it filled the card almost exactly and then had nowhere to put the next 768 MiB chunk.
The fix: vLLM lists the three real options itself, and for our case only one of them helps. Lowering --gpu-memory-utilization would make things worse, not better, because it reduces the space available for weights.
Quantizing further would work but changes the model. So the answer is more GPUs, which is the whole point of this post.
Worth knowing: this one is slow to fail, because it has to read and place most of the weights before it runs out. Budget several minutes, unlike the divisibility error which fails instantly.
"Unknown SF transformation", the one that cost us the most time #
This is the error we did not see coming, and it is worth the whole section. With 4 GPUs and everything sized correctly, all four workers died during startup:
RuntimeError: Assertion error (/workspace/.deps/deepgemm-src/csrc/apis/layout.hpp:60):
Unknown SF transformationWhat it means: this model stores its FP8 weights in blocks, with a separate scale factor per 128x128 block, which you can see in its config as "weight_block_size": [128, 128]. vLLM hands that kind of matrix multiplication to a library called DeepGEMM, and DeepGEMM did not know how to lay out those scale factors ("SF" is scale factor) on our particular GPU. The RTX PRO 6000 is Blackwell, but it reports as sm_120, which is not the same silicon target as the data-centre Blackwell parts that DeepGEMM is usually exercised on.
Notice how unhelpful the message is if you do not know that background. Nothing in it mentions FP8, quantization, or your GPU.
The fix, which is one environment variable:
docker run -d ... -e VLLM_USE_DEEP_GEMM=0 ... vllm/vllm-openai:latest ...That tells vLLM to use its own FP8 kernels instead of DeepGEMM. Startup then went through cleanly. There is a performance cost to giving up a specialised kernel, so on hardware where DeepGEMM works you would leave it on.
The general lesson: a quantized model is a contract between the checkpoint's format and a kernel that understands it. When a big quantized model fails to start on hardware that clearly has enough memory, suspect the kernel and the number format before you suspect your parallelism settings.
A confusing parse error when you try to run something else in the container #
vllm serve: error: argument --compilation-config/-cc: Invalid JSON: expected value at line 2What it means: you ran docker run ... vllm/vllm-openai:latest python3 -c "...", but the image's entrypoint is already vllm serve, so your Python source got handed to vLLM as a command-line argument.
The fix: --entrypoint python3, as shown in Step 5.
"No available shared memory broadcast block found in 60 seconds" #
What it means: usually nothing. It shows up while vLLM is busy compiling or capturing CUDA graphs and the worker processes have not checked in for a minute. If it repeats forever and startup never finishes, then you probably forgot --ipc=host and the workers cannot pass data to each other through shared memory.
The fix: add --ipc=host. If you already have it, wait a bit longer, because CUDA graph capture on a big model is genuinely slow.
That is the runbook complete: the model is serving, you know what every flag is doing, and you know the failure modes. If you stopped here you would be in good shape. What follows is for the day you want to know why the numbers came out the way they did.
The deep dive: what splitting actually means #
This half is for the reader who wants the machinery. No root access is required, and nothing here is needed to operate the server. When people say "split the model across GPUs" they could mean three genuinely different things, and mixing them up is the source of most confusion about multi-GPU performance. By the end of this track you will be able to look at any benchmark table and know which of the three splits produced it.
Deep dive 1: Where the memory really goes #
Step 2 gave you the fit-check recipe; here is what is behind it. A model is mostly a big pile of numbers called parameters or weights, and the weights are the easy part: parameters times bytes-per-parameter, fixed and known in advance. The interesting tenant in GPU memory is the KV cache.
Every token the model reads or writes leaves behind a key and a value at every layer (the 2 in the formula), and those records have to be kept for as long as the request is alive, because decode rereads all of them to produce each new token. The per-token cost is set entirely by the architecture: 94 layers, 4 KV heads, head dimension 128, kept in BF16 at 2 bytes:
2 x 94 x 4 x 128 x 2 = 192,512 bytes = 188 KiB per token188 KiB does not sound like much. But this model supports a 262,144 token context, so one single conversation at full length would need 262,144 x 188 KiB, which is about 47 GiB. That is half a GPU for one user.
Serving ten users at once with long prompts is where all your leftover memory goes, and it is why "the weights fit, so I am fine" is wrong, and why the runbook caps --max-model-len at 32,768 rather than letting one request hold 47 GiB hostage.
Two consequences worth carrying forward. First, a model's conversation capacity is an architectural property, not just a memory-size property: this model's 4 KV heads make its cache unusually cheap per token.
Second, whichever way you split the model across GPUs, what happens to this cache (divided, duplicated, or taxed) matters as much as what happens to the weights. Keep that question in mind through the next four sections.
Deep dive 2: Inference is two jobs #
Before splitting anything, it helps to know what the work being split actually is, because inference is really two different jobs wearing one coat. Almost everything confusing about multi-GPU performance comes from this split.
Phase one: prefill, reading your prompt #
When your prompt arrives, the model has to read all of it. If you send 1,000 tokens, all 1,000 go through every layer at once, as one big batch of work. This is called prefill, and it is the phase that decides your time to first token.
Prefill is compute-heavy. There is a lot of arithmetic to do and the GPU's matrix engines are the bottleneck. It also produces the keys and values for every one of those 1,000 tokens, which get written into the KV cache and kept.
One more thing becomes true once the model is split over several GPUs: prefill is also the phase where the GPUs send each other the most data, because every exchange between them carries your whole prompt rather than a single token.
That makes prefill the phase most sensitive to how fast the link between the GPUs is. Our machine has no NVLink, so its GPUs talk over the slower PCIe path, and the measurements later show the bill for that: the splitting method that talks the most lost time to first token, and the method that barely talks won it.
Phase two: decode, writing the answer #
Then the model writes its reply, and here is the part that surprises people: it can only produce one token at a time. To write token 2 it needs to have written token 1, because it feeds its own output back in. There is no way around that, it is what "autoregressive" means.
So decode is a loop. Each pass through it produces exactly one token, reads the entire KV cache built so far, and appends one more entry to that cache.
Decode is memory-heavy rather than compute-heavy. For a single token there is barely any arithmetic to do, but the GPU still has to stream the relevant weights and the whole KV cache past its compute units.
The bottleneck is memory bandwidth, not maths. That is why decode speed tracks memory bandwidth so closely, and why giving a single request more GPUs to read from in parallel actually helps.
Two phases, two different bottlenecks, and they respond differently to everything you tune:
| Prefill | Decode | |
|---|---|---|
| Work per step | your whole prompt at once | exactly one token |
| Bottleneck | compute | memory bandwidth |
| Metric it drives | time to first token | time per output token |
| Data moved between GPUs | large, whole prompt's worth | tiny, one token's worth |
That last row is the one to hold on to. It is the reason, later, that pipeline parallelism wins on first-token latency while tensor parallelism wins on tokens per second. The same all-reduce that is trivially cheap during decode is expensive during prefill, because it is carrying a thousand times more data.
How the server juggles many users #
A real server is not doing one request at a time. vLLM uses continuous batching, which means it does not wait for a batch to fill up or finish. On every step it looks at everything currently in flight and assembles whatever work is ready, so a request that arrives mid-flight joins the very next step rather than queueing behind a whole batch.
Two consequences worth knowing:
- Prefill and decode get mixed together. A step might carry one user's fresh 1,000-token prompt alongside twenty other users' single decode tokens. That mixing is why a burst of long prompts makes everyone else's tokens arrive more slowly, and it is why
--max-num-batched-tokensexists as a lever. - Capacity is set by the KV cache, not by CPU or queue length. Every in-flight request is holding cache proportional to its length. When the cache is full, vLLM has to preempt somebody: it evicts a request's cache and recomputes it later. That is the real meaning of the
Maximum concurrencyline in the startup log from Step 6.
Now that the work itself is clear, let's look at the three ways to spread it over more than one GPU.
Deep dive 3: The three ways to split #
Here is the heart of it. An analogy first, because it makes the rest much easier to hold in your head. Imagine a large restaurant kitchen that has to produce one dish:
- Tensor parallelism is four chefs all working on the same dish at the same time, one chopping, one on sauce, one on protein, one plating. They constantly have to coordinate, but the dish is done fast.
- Pipeline parallelism is four chefs at four stations, where the dish moves down the line. Station two cannot start until station one is finished. Very little talking, but three chefs are idle at any moment unless you have several dishes in flight.
- Expert parallelism is a kitchen with 128 specialist chefs where each dish only needs 8 of them. You spread those 128 chefs across four rooms, and each dish gets walked to whichever rooms hold the specialists it needs.
Three ways to split animation
The same model, cut three different ways across four GPUs
These are not competing products, they are three different cuts through the same pile of weights, and you can combine them. Each box below is one GPU. Watch which parts light up, because that tells you which GPUs are doing work at the same moment.
Tensor parallelism
--tensor-parallel-sizeWhat it doesCut every layer into vertical strips. Each GPU holds a strip of all 94 layers.
How much it talksA lot. Twice per layer, so 188 times per token.
When it winsFastest for a single user, because all 4 GPUs work on the same token.
Pipeline parallelism
--pipeline-parallel-sizeWhat it doesCut the stack into horizontal blocks. With 94 layers over 4 GPUs, each one owns about 23 of them.
How much it talksBarely. One handoff between neighbours per token.
When it winsKind to a slow network between GPUs, but a GPU waits its turn.
Expert parallelism
--enable-expert-parallelWhat it doesDeal the 128 experts out like cards. Each GPU keeps 32 of them, whole.
How much it talksMedium. Tokens are shipped to whichever GPU owns the expert they need.
When it winsOnly exists for MoE models, and it is how the really big ones are served.
All three can be combined, and in production they usually are. Now let's look at the two interesting ones up close.
Deep dive 4: Tensor parallelism, up close #
Tensor parallelism cuts inside every layer. This is the important distinction: it does not give GPU 0 the first half of the model and GPU 1 the second half. Every GPU holds a thin slice of all 94 layers.
How can you cut a layer? Because the work a layer does is mostly one big multiplication table, and multiplication tables can be cut up. The technique comes from a 2019 NVIDIA paper called Megatron-LM, and it works in two moves.
Move one, cut the first matrix into vertical strips. Each GPU takes some of the columns. Because each GPU has complete columns, it can finish its part, including the activation function in the middle, without asking anyone anything. In our model the attention block has 64 heads, so with 4 GPUs each one owns 16 whole heads and computes them start to finish alone.
Move two, cut the second matrix into horizontal strips. These line up exactly with the vertical cuts from move one. Each GPU multiplies its slice and gets a partial answer, a quarter of the real result.
Now, and only now, the GPUs have to talk. They add their four partial answers together so that everyone ends up with the complete result. That single operation is called an all-reduce: everyone contributes a piece, everyone gets the total back.
The Megatron paper puts the cost plainly, saying this design lets you run a transformer layer "using only two all-reduces in the forward path". Generating text only uses the forward path, so:
- 2 all-reduces per layer
- 94 layers
- 188 all-reduces to produce one single token
And they happen strictly one after another, because layer 5 cannot begin until layer 4 has finished comparing notes.
Tensor parallelism animation
One layer, sliced four ways
This is the part people usually get wrong, so it is worth being precise. The weights get divided, and the thing flowing through them does not. Every GPU starts each layer holding an identical copy of the token, does a quarter of the arithmetic on its own slice of the weights, and ends up with a quarter of an answer. Then they add their quarters together.
GPU 0heads 0-15
16 of 64 heads
1 of 4 kv heads
each square above = 4 heads
a quarter answer
GPU 1heads 16-31
16 of 64 heads
1 of 4 kv heads
each square above = 4 heads
a quarter answer
GPU 2heads 32-47
16 of 64 heads
1 of 4 kv heads
each square above = 4 heads
a quarter answer
GPU 3heads 48-63
16 of 64 heads
1 of 4 kv heads
each square above = 4 heads
a quarter answer
The KV cache gets divided too, which is a bonus #
Because each GPU owns only some of the attention heads, it only needs to remember keys and values for its own heads. So the KV cache is divided across GPUs rather than duplicated. Four GPUs give you roughly four times the room for conversations, on top of making the weights fit. This is a real and often unmentioned benefit of tensor parallelism.
You can check it against the real run. The whole-model cache costs 188 KiB per token, so at TP=4 each card keeps one of the 4 KV heads and pays 47 KiB per token. Divide the 27.85 GiB of cache memory from Step 6's startup log by 47 KiB and you predict 621,337 tokens of capacity. vLLM printed 621,392. When a mental model predicts a five-significant-figure log line, you can trust the mental model.
Deep dive 5: The expert part #
Our model is a mixture of experts, and this is the single biggest idea in how large models are served today, so it is worth slowing down for.
In an ordinary model, every parameter is used for every token. In a mixture-of-experts model, each layer contains many small networks called experts, and a tiny component called a router decides which few of them each token should visit. Our model has 128 experts per layer and the router picks 8 of them per token.
So the model holds 235B parameters in memory, but only about 22B of them do any arithmetic for a given token. That is what "235B-A22B" means, and it is why this model runs far faster than its size suggests. You pay for the full 235B in memory and you pay for only 22B in speed.
Expert routing animation
Why a 235B model only does 22B of work per token
Every layer of this model has 128 small expert networks, and a tiny router picks just 8 of them for each token. The other 120 sit still. That is the whole trick of a mixture of experts: you pay for 235B parameters in memory, but only about 22B of arithmetic per token.
GPU 0experts 0-31
2 of 32 firing
GPU 1experts 32-63
2 of 32 firing
GPU 2experts 64-95
2 of 32 firing
GPU 3experts 96-127
2 of 32 firing
This gives you a third way to split. Instead of slicing every expert into strips, you hand out whole experts: with 128 experts and 4 GPUs, each GPU keeps 32 of them intact. That is expert parallelism, and in vLLM you switch it on with --enable-expert-parallel.
The trade is different from tensor parallelism. Nothing needs adding up at the end, but tokens have to travel to whichever GPU owns the expert they were routed to, and the answers travel back. It also has a fairness problem: the router does not promise to spread work evenly, so one GPU can end up with more popular experts and become the slow one holding everybody up.
Deep dive 6: Why you cannot split forever #
Step 3 gave you the rule as a checklist item; here is the reasoning underneath it.
Attention heads are computed whole: Deep dive 4 showed each GPU owning 16 complete heads and finishing them alone. A head cannot be half on one GPU and half on another without turning every attention step into a network call, so vLLM refuses to try: your tensor parallel size must divide the head counts in config.json (shown in full in Step 3).
For our model the arithmetic lands like this. num_attention_heads is 64, which divides generously: 2, 4, 8, 16 all work. But num_key_value_heads is 4, and that is the binding constraint: at -tp 4 each GPU holds exactly one KV head, and at -tp 8 there are not enough to go around, so vLLM has to duplicate them across GPUs, which costs memory and erodes exactly the cache-division bonus that made tensor parallelism attractive in Deep dive 4. Meanwhile num_experts is 128, divisible by 4 and 8 alike, which is why expert parallelism has more freedom than tensor parallelism on this model.
That is the real lesson: the KV head count, not the parameter count, usually decides how wide you can go. Grouped-query attention (few KV heads shared by many attention heads) is what makes modern models cheap to cache, and the same design choice is what caps their tensor-parallel width. The cheapness and the cap are the same number. Break the rule and vLLM fails in about a second, with the exact error shown in Step 8.
Deep dive 7: The proof #
Theory is cheap, so we measured it: all three splits, same model, same 4 GPUs, same benchmark: vLLM's own, 1024 tokens in and 256 out, run at one request at a time and again with 32 in flight, because those two regimes behave completely differently and a configuration that wins one can lose the other. The exact commands are in Step 7.
The memory side #
| TP=4 | TP=4 plus EP | PP=4 | |
|---|---|---|---|
| Weights per GPU | 55.19 GiB | 55.19 GiB | 55.70 GiB |
| KV cache per GPU | 27.85 GiB | 27.96 GiB | 26.84 GiB |
| Total KV cache | 621,392 tokens | 623,696 tokens | 555,680 tokens |
| Max concurrency at 32k | 18.96x | 19.03x | 16.96x |
| GPU memory used | 88,211 MiB on all 4 | 88,209 MiB on all 4 | 84,283 / 87,899 / 87,899 / 84,507 |
Two things to pull out of that table.
Expert parallelism did not save memory. It moved 0.37% of extra room into the cache, which is noise. If you were hoping expert parallelism would let you fit a model that otherwise does not fit, this is your warning that it will not.
Pipeline parallelism cost us 11.8% of the cache, dropping from 621,392 tokens to 555,680, because a pipeline needs extra buffers for the activations travelling between stages, and that comes straight out of your conversation capacity.
Look at the last row too. Under tensor parallelism all four cards sat at exactly 88,211 MiB, the same number on every one of them. Under pipeline parallelism they ranged from 84,283 to 87,899 MiB, about 3.6 GB apart, because a layer split cannot be perfectly even when 94 layers go over 4 GPUs and the ends of the model are not symmetric: the first stage carries the token embedding and the last carries the output head. That evenness check is the quickest sanity test you have that a tensor-parallel split is behaving.
The speed side #
| Measurement | TP=4 | TP=4 plus EP | PP=4 | Winner |
|---|---|---|---|---|
| Median time per token, 1 request | 17.14 ms | 18.83 ms | 21.19 ms | TP |
| Output tokens/sec, 32 requests | 503.68 | 470.93 | 296.48 | TP, by 70% over PP |
| Median time to first token, 32 requests | 3,233 ms | 3,705 ms | 2,735 ms | PP, by 15% |
| Benchmark duration, 32 requests | 65.06 s | 69.58 s | 110.52 s | TP |
Tensor parallelism won nearly everything, and the size of one gap deserves attention: at 32 concurrent requests it produced 70% more tokens per second than pipeline parallelism. That is not a rounding error, that is a different class of performance, and it lines up exactly with the theory from Deep dive 3. Tensor parallelism has all four GPUs working on every token. Pipeline parallelism has each GPU working on a different request's stage, and with only 32 requests spread over 4 stages there is not enough in flight to keep everyone busy, so cards sit idle waiting for their turn. Its median time per token was 24% worse for the same reason.
Pipeline parallelism did win one thing, and it is the one theory predicts: time to first token, by 15%. Processing your 1024-token prompt is where tensor parallelism's chatter gets expensive, because each of those 188 all-reduces is carrying the whole prompt's worth of data rather than a single token's. Pipeline parallelism just hands one activation tensor to the next stage and skips all of it. If your users judge you on how fast the first word appears, that is a real and measurable advantage. This is the two-jobs split from Deep dive 2 showing up in a table: prefill moves a lot of data between GPUs, decode moves almost none, so the talkative strategy pays during prefill and collects during decode.
That is not a knock on expert parallelism, and it is important not to over-read it. Expert parallelism exists to solve a problem we do not have here: models so large that even a tensor-parallel split cannot hold all the experts, and clusters big enough that duplicating experts everywhere would be wasteful. With 4 GPUs and a model that already fits, we are asking it to do a job it was not designed for, and paying an extra network hop per token for nothing; here it cost 7% and returned nothing. On a 32 or 64 GPU deployment of a trillion-parameter model the answer would very likely flip.
The number we threw away, and why #
Being straight about this because it is a good lesson in reading your own benchmarks. The very first expert-parallel run at one-request-at-a-time reported 28.71 output tokens per second, which would have made expert parallelism look catastrophic. It was not real. Look at the two TTFT figures from that run:
Mean TTFT (ms):    3987.38
Median TTFT (ms): 265.56A mean fifteen times the median means one request behaved completely differently from the other eleven. One request stalled for about 45 seconds, almost certainly a one-off kernel compilation on the first pass through a code path, and that single stall stretched the whole benchmark from 63 seconds to 107 seconds. Since throughput is just tokens divided by wall-clock, one stall wrecked the headline number.
This is why the table above uses median time per token as the decode measurement rather than aggregate throughput. Median per-token latency does not care that one request had a bad start.
One more benchmarking trap while we are here. When we re-ran that same benchmark on the warm server, time to first token dropped from 265 ms to 61 ms, which looks like a wonderful improvement and is actually meaningless: vLLM caches prompt prefixes by default, and we had just sent it those exact prompts with the same --seed 42. If you are comparing configurations, either vary the seed or turn prefix caching off, otherwise your second measurement is mostly measuring your cache.
Wrapping up #
If you take five things away from this, let them be these.
One. Inference is two jobs, not one. Prefill reads your whole prompt at once and is limited by compute; decode writes one token at a time and is limited by memory bandwidth. Every confusing multi-GPU result in this post traces back to that split, so when a change helps one metric and hurts the other, this is why.
Two. Work out the memory on paper first. Parameters times bytes-per-parameter gives you the weights, and then remember that the weights are only one of three things that must fit, alongside the conversation cache and the working space. A model whose weights just barely fit is a model that cannot serve anybody.
Three. "Splitting across GPUs" is three different things. Tensor parallelism slices every layer and makes all your GPUs work on the same token, at the cost of constant chatter. Pipeline parallelism cuts the layer stack into blocks and barely communicates, at the cost of GPUs waiting their turn. Expert parallelism only exists for mixture-of-experts models and hands out whole experts. You can combine them, and for big models you usually do.
Four. Read the startup log. Model loading took, Available KV cache memory, GPU KV cache size and Maximum concurrency tell you, in four lines, whether your setup is sane and how many users it can actually hold. A negative cache number is the clearest error message in the whole stack.
Five. Check num_key_value_heads in config.json before you plan your hardware. It, not the parameter count, is usually what limits how many GPUs you can split across cleanly.
One last practical warning, because it cost us more than any GPU problem did. Check your disk before you download. A quarter of a terabyte of model weights on a shared machine is not just a storage question, it is a question about everything else living on that disk. Ours was a Kubernetes node, free space crossed the kubelet's eviction threshold, and it evicted the platform's own pods and garbage-collected locally-built images that no registry could replace. df -h first, and leave real headroom.
Try it on whatever you have. Two GPUs are enough to see every concept in this post in action, and the log lines mean the same thing whether you are running 4 GPUs or 40. If you hit something we did not cover, tell us and we will add it.
Credits and references #
- The tensor parallel scheme is from Megatron-LM: Training Multi-Billion Parameter Language Models Using Model Parallelism by Mohammad Shoeybi, Mostofa Patwary, Raul Puri, Patrick LeGresley, Jared Casper and Bryan Catanzaro: arxiv.org/abs/1909.08053
- vLLM parallelism and scaling guide: docs.vllm.ai/en/latest/serving/parallelism_scaling.html
- vLLM memory and optimization docs: conserving_memory and optimization
- Model card and config: huggingface.co/Qwen/Qwen3-235B-A22B-Instruct-2507-FP8
- Thanks to the vLLM maintainers, whose startup logging is the best free lesson in distributed inference available anywhere.
Building Hybrid K8s Platforms @trivago | Tech Author & Speaker (freeCodeCamp, SREDays) | vCluster Ambassador | RHCA & GCP DevOps Professional
Saiyam is working as Head of DevRel at vCluster Labs. He is the founder of Kubesimplify, focusing on simplifying cloud-native & AI infrastructure. He is KubeCon Co-chair and has worked on many facets of Kubernetes, including machine learning platforms, scaling, multi-cloud, & managed Kubernetes services. When not coding, Saiyam contributes to the community by writing blogs and organizing local meetups for Kubernetes and CNCF. He is also a CNCF TAG OpsRes Chair & can be reached on Twitter @saiyampathak.
Get new posts in your inbox.
Spotted a typo or want to improve this post? Edit on GitHub →